

Pak vs Aus Live Score in Detail: How to Read a Scorecard Like an Analyst
“Pakistan 198/5” tells you the score. The detail tells you the story: who accelerated when, which bowler was targeted, where the game turned. This guide decodes every element of a detailed Pak vs Aus live score — so you read matches the way analysts do.
Quick answer: A detailed live score shows: runs/wickets and overs, batter strike rates, bowler economy and figures, partnerships, fall of wickets, Manhattan (over-by-over runs) and worm (cumulative) charts, wagon wheels of scoring areas, and win predictors. Together they reveal the match’s momentum and turning points.
In this guide
Scorecard basics
| Element | What it means | |
|---|---|---|
| 198/5 (20 ov) | 198 runs for 5 wickets in 20 overs | |
| Strike rate 150 | Batter scores 1.5 runs per ball faced | |
| Economy 6.50 | Bowler concedes 6.5 runs per over | |
| Figures 3/24 | Bowler took 3 wickets for 24 runs | |
| Partnership 80 (52) | 80-run stand off 52 balls | |
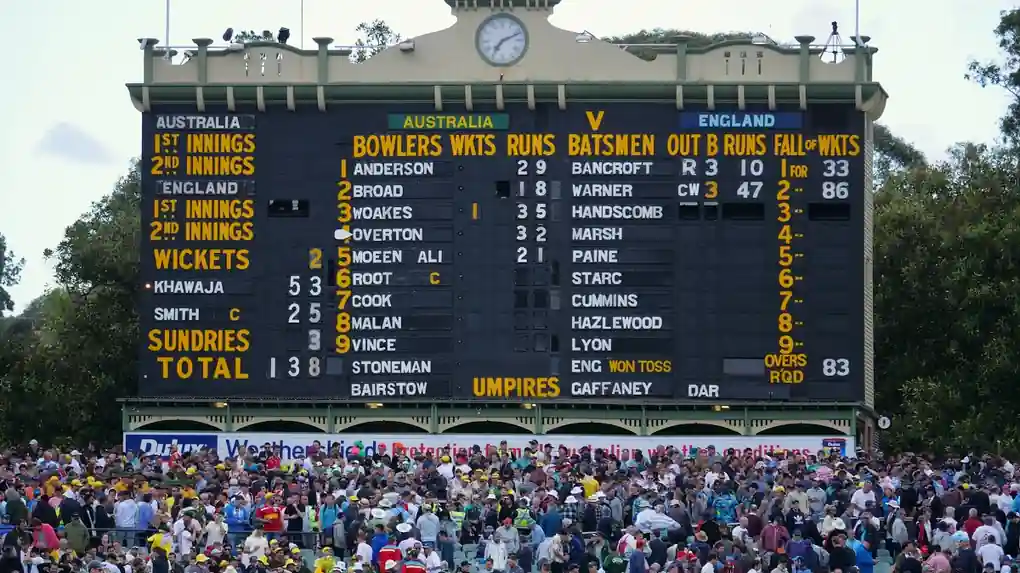
| FOW: 45-1 | First wicket fell at team score 45 |
Charts: Manhattan, worm and wagon wheels
The Manhattan chart shows runs per over as bars — tall bars reveal the overs where the game broke open (in the 3rd T20I of 2026, Pakistan’s middle overs towered). The worm plots cumulative scores of both innings — where the lines cross or diverge, the match turned. The wagon wheel maps where each batter scored: clusters behind square or down the ground expose a bowler’s failing lines. In Pak vs Aus games, watch Australia’s pace attack’s wagon wheels against Pakistan’s batters — leg-side clusters usually mean the short-ball plan is leaking.
Win predictors: useful, not gospel
Win predictors crunch historical data — required run rate, wickets in hand, venue history — into a live percentage. They’re excellent at quantifying momentum but blind to context: a set batter’s injury, dew, or a tail-ender’s day out. Use the predictor to sense pressure, not to call the result. For the rivalry context behind the numbers, the Pak vs Aus hub has the head-to-head history.
Pakistan vs Australia: head-to-head record
One of cricket’s great asymmetric rivalries — Australia dominant overall, Pakistan dangerous at home and in Asia.
| Format | Played | Pakistan won | Australia won | Drawn/NR | |
|---|---|---|---|---|---|
| Tests | 72 | 15 | 37 | 20 draws | |
| ODIs | 111 | 36 | 71 | 4 NR | |
| T20Is | 28 | 12 | 14 | 2 NR |
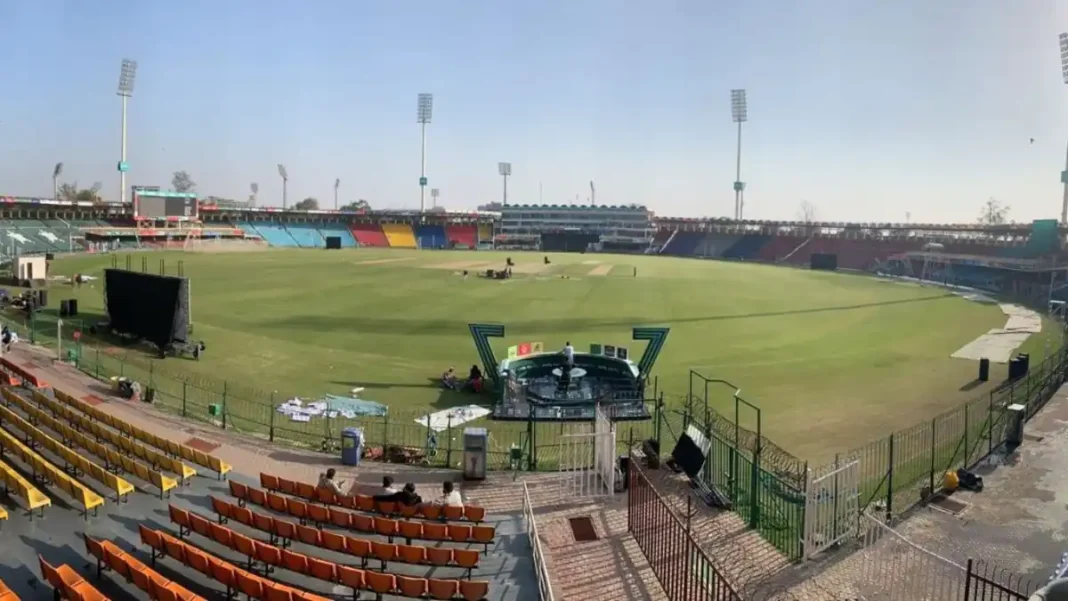
Recent form favours Pakistan at home: Australia’s T20I tour of Pakistan in Jan–Feb 2026 ended in a 3–0 series win for the hosts at Gaddafi Stadium, Lahore. But Australia’s Test dominance — especially in Australian conditions — remains the rivalry’s defining pattern.
Frequently asked questions
What does 198/5 mean in a live cricket score?
198 runs scored for the loss of 5 wickets. In T20s it is usually followed by overs bowled, e.g. 198/5 (20 ov) — a full innings.
What is a good strike rate in T20 cricket?
Above 140 is excellent, 120–140 solid, below 100 a struggle — though match situation matters: an anchor’s 110 can be match-winning if others hit around him.
Who has won more matches, Pakistan or Australia?
Australia lead in all three formats: Tests 37–15, ODIs 71–36, T20Is 14–12 (figures as of early 2026). Pakistan’s wins cluster at home and in Asian conditions.
When did Pakistan last beat Australia in a Test series?
Pakistan’s most famous recent Test success against Australia came in the UAE in 2014 (2–0) and 2018 (1–0); beating Australia in Australia remains the unconquered frontier.